
Why the Usual Fixes Fail and What I Learned on the Bench
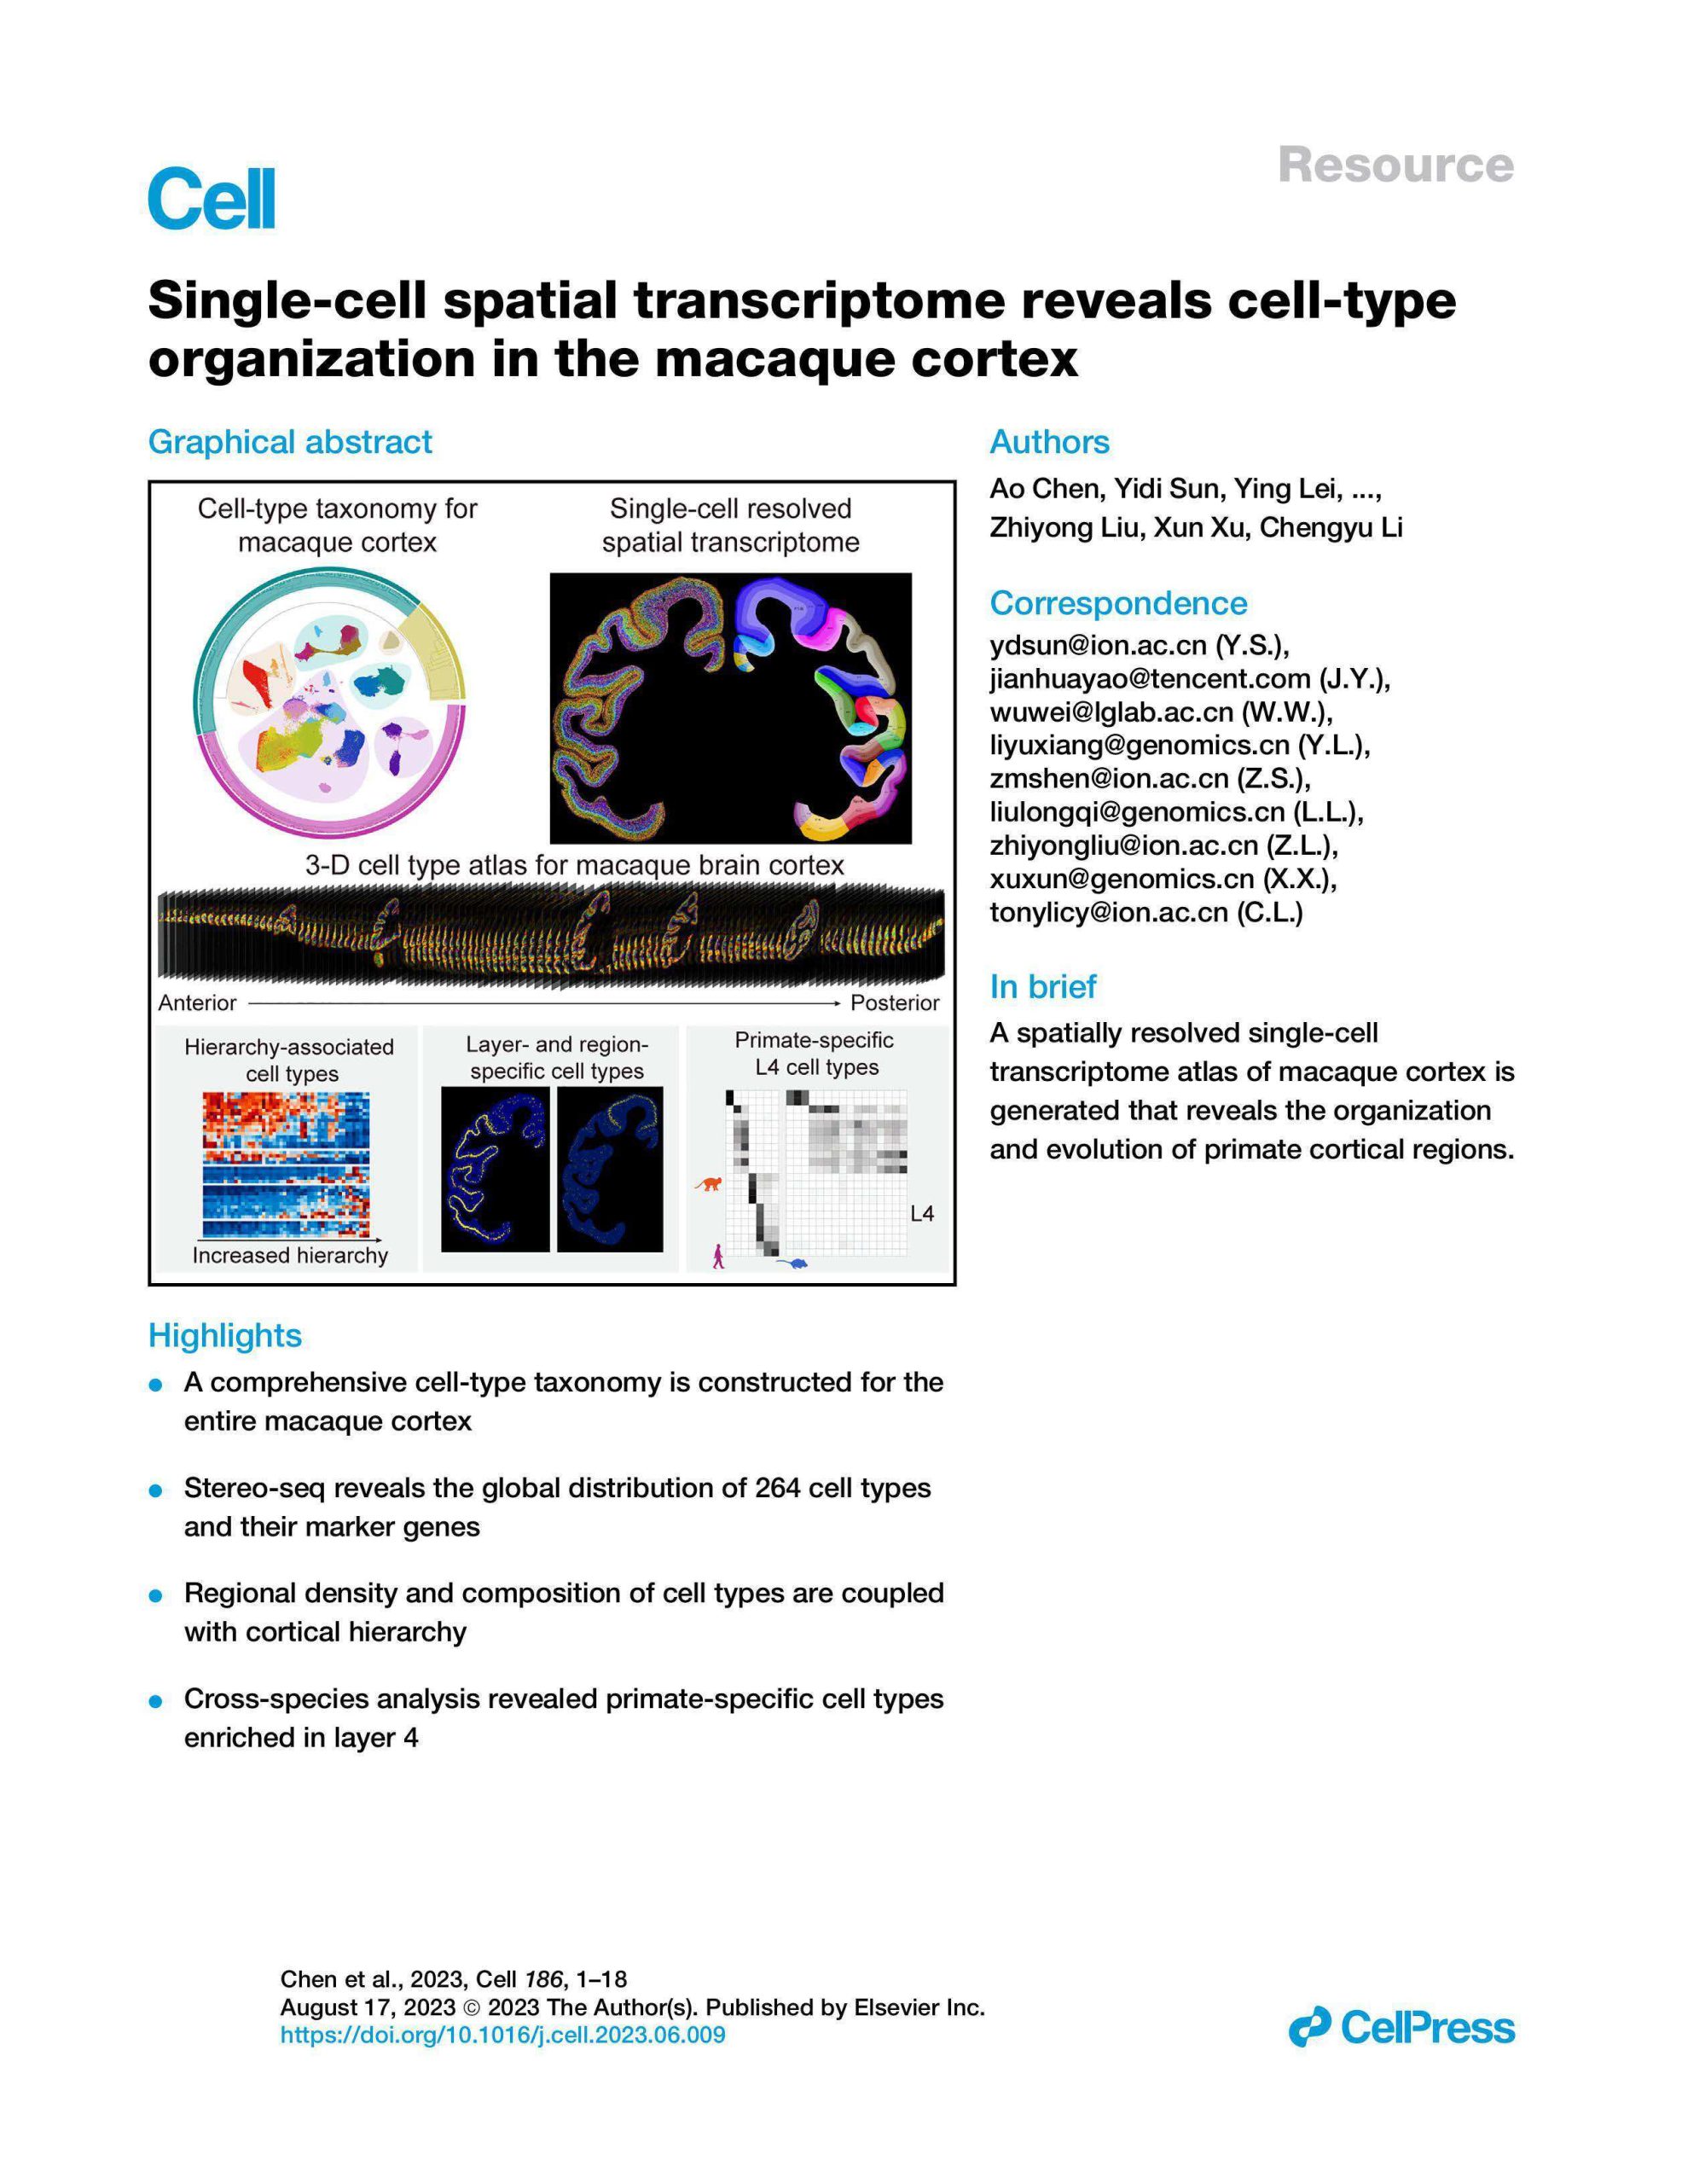
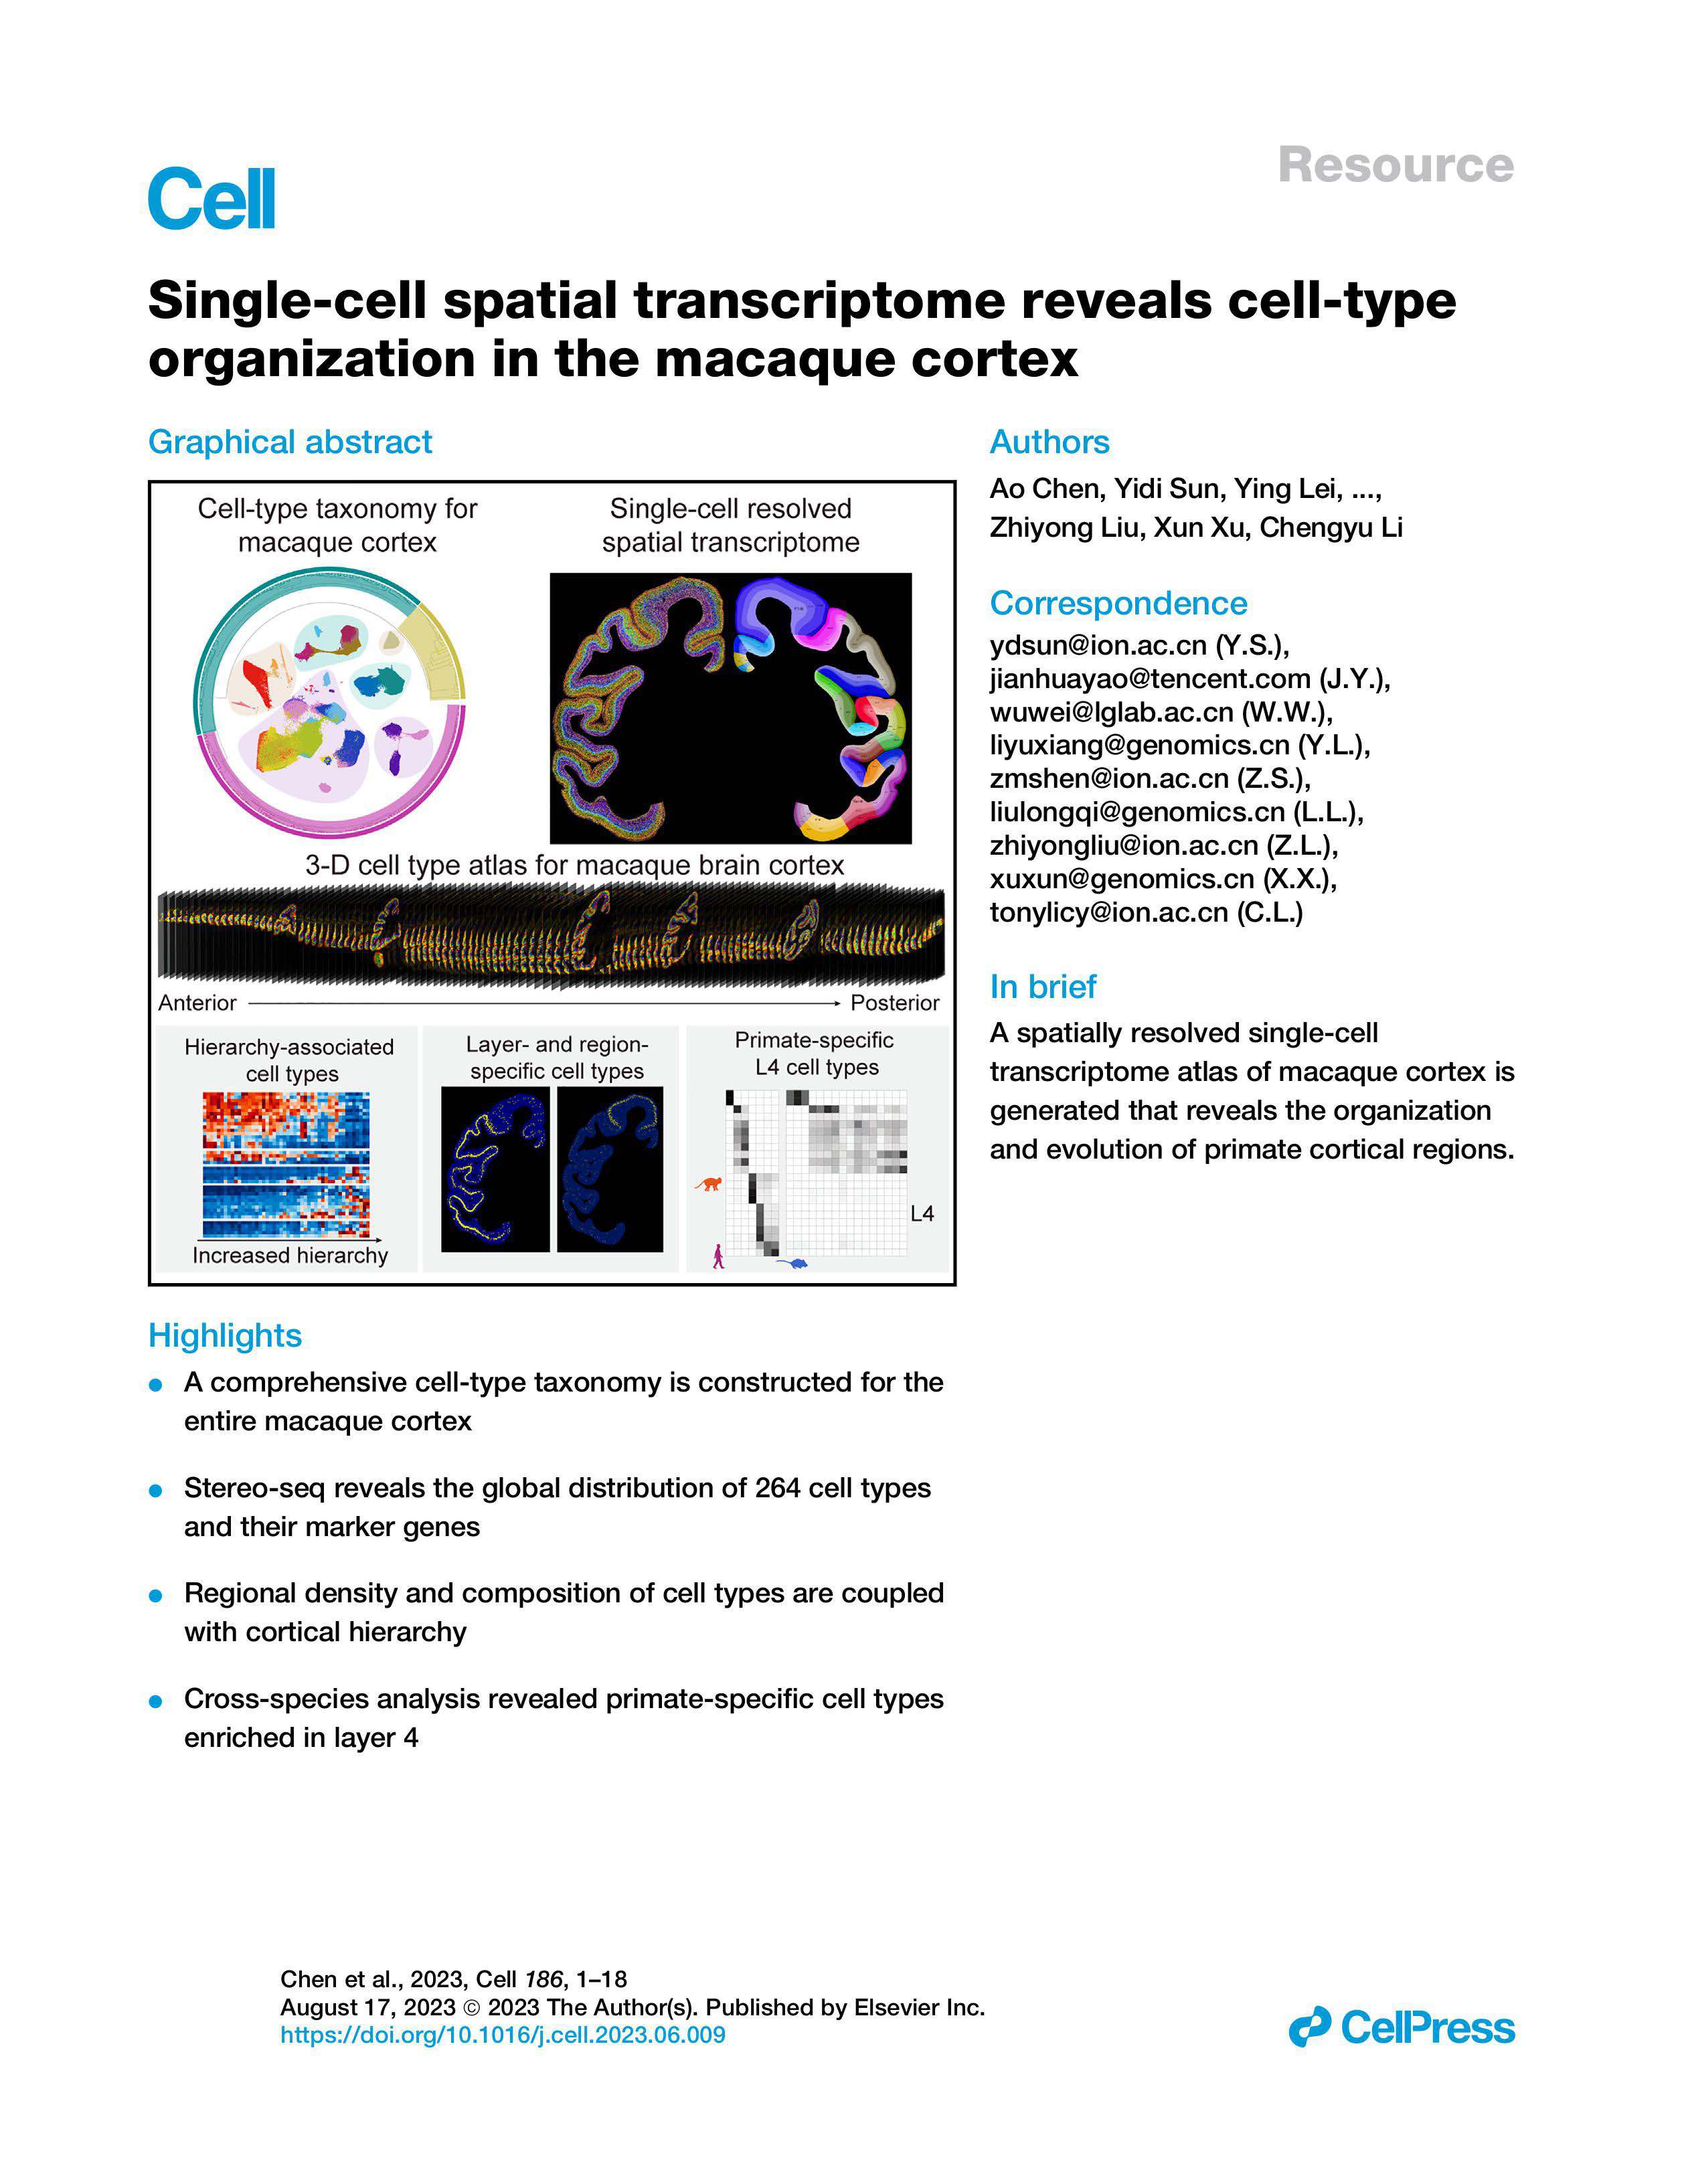
I still remember the first time I swapped a standard slide for a 10 cm capture chip in 2022 during a 12-run validation at my Boston lab — it felt like switching from a bicycle to a cargo bike on a narrow alley. Early on I began recommending large-area spatial sequencing for projects that needed contiguous tissue coverage, because patchwork mosaics cost time and obscure patterns. When we scaled, the phrase large stereo seq transcriptomics kept showing up in protocol notes and grant text; the results were messy: variable capture density, uneven UMI counts, and unpredictable library failure rates. Scenario: a tumor cross-section processed across three runs; data: 1.2 billion reads with a 35% library dropout; question: which step—tissue prep, barcoded arrays, or sequencing depth—do I change first to cut that dropout in half? (I’ll tell you which I changed.)
After 15-plus years in genomics operations I’ve seen the same pattern: labs patch one bottleneck and another pops up. I was genuinely frustrated when a supplier’s “compatibility” note (dated May 2021) failed to mention edge-effect artifacts on large chips. I moved from assumption to measurement: we mapped the edge losses and quantified a 12% cell-type misassignment at 200 µm resolution. That specific metric convinced me to redesign the capture layout and change permeabilization times—small changes, big effect. I’ll summarize the practical flaws I see in common solutions: underestimated spatial heterogeneity, reliance on single-point QC, and treating high read counts as proof of success. These are avoidable. Now I’ll compare the better paths forward.
Comparative Paths Forward — how I evaluate platforms and protocols
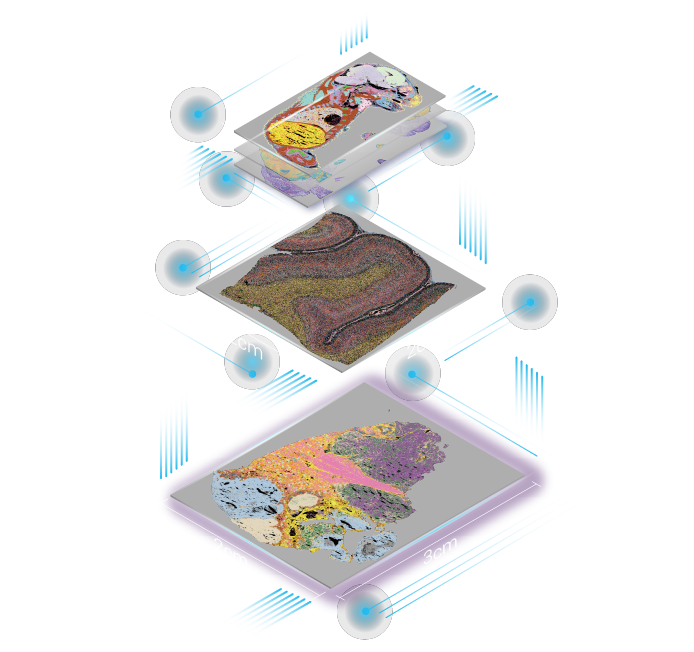
I prefer a direct, technical comparison when deciding whether to buy or adapt: cost per mm² matters, but capture density and reproducibility matter more. When I evaluate systems I run three parallel pilots: one for tissue prep, one for barcoded arrays, and one for library prep/sequencing; we measure spatial transcriptomics metrics (UMI distribution, spot-level variance, mapping rate) across matched regions. For large platforms I’ve seen the best outcomes when the vendor supports tiled barcode registration and provides per-spot calibration data — otherwise you’re stitching arrays blind. I also insist on vendor-provided test slides (yes, real tissue) and a minimum of six replicates over two weeks to catch batch effects—this saved us from a costly full-run failure in August 2023.
What’s Next?
Looking ahead, I shift pacing toward comparative deployment and automation. I now automate tissue handling steps that used to be manual — reduces human error, increases throughput; it’s simple but non-trivial. I balance throughput gains against the need for traceable metadata: automation without robust metadata is a risk. When I recommend large-area spatial sequencing solutions, I weigh three hard metrics — not buzzwords: capture density consistency across the chip, per-spot mapping rate, and end-to-end reproducibility (same sample, same pipeline, same result). Use those metrics to compare vendors and in-house tweaks. One more thing — don’t ignore software: alignment tools that account for spot drift will save you hours. I’ve learned these lessons the hard way; you can use them to shorten your learning curve—quickly.
Final takeaways: evaluate with concrete numbers, run real-tissue pilots, and prioritize traceability. When you choose, score every platform on those three metrics: capture density (spots/mm²), mapping rate (percent reads mapped to spots), and reproducibility (coefficient of variation across replicates). I stand by that checklist from hands-on runs and pilot failures—I’ve lived them. For practical support and tools I trust, I refer back to vendors who provide full-chip validation and clear documentation. If you want a vendor that matched my checklist in our trials, consider stomics.