
Introduction
Choosing the right model shapes the study before a pipette touches tissue. For teams focused on metabolic endpoints, a clear comparative view helps avoid wasted months and unclear data. WHO reports that over 400 million people live with diabetes worldwide, a useful anchor when prioritising translational relevance, and many labs now test interventions side-by-side using dedicated metabolic disease models or a single, well-characterised animal model of metabolic disease to speed decision-making. Key terms to track from the start are insulin resistance and glucose tolerance test; they will recur in protocol decisions.
Why careful comparison matters
Different models capture distinct biology: diet-induced obesity models mimic lifestyle-driven insulin resistance, while streptozotocin (STZ) models emphasise beta-cell loss. Translational value depends on the question—mechanism, biomarker discovery, or therapeutic efficacy. Study length, cost, and endpoint sensitivity vary by model, so upfront comparison saves resources and clarifies which phenotyping assays you must budget for.
Common models and their trade-offs
Below are concise comparisons to guide selection:
– High-fat diet (HFD) in mice: Rising similarity to human metabolic syndrome, good for insulin resistance studies; typical induction requires 12–16 weeks. Advantage: intact immune and islet interplay. Drawback: slower onset and variable severity.
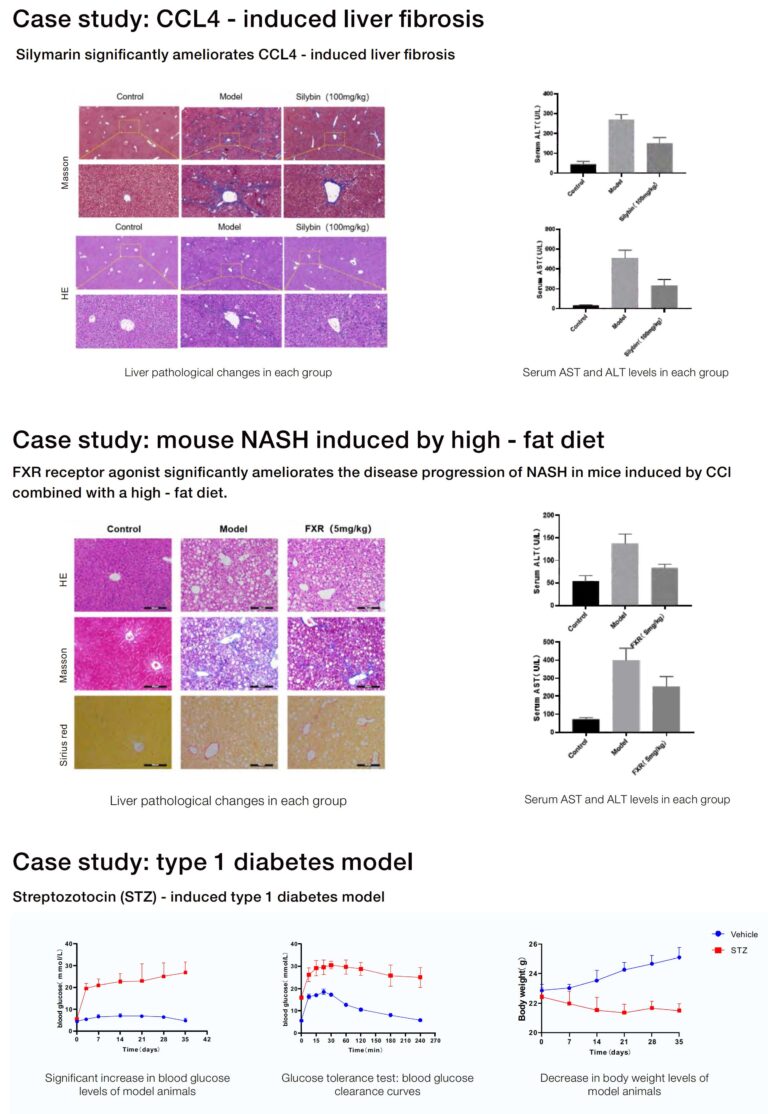
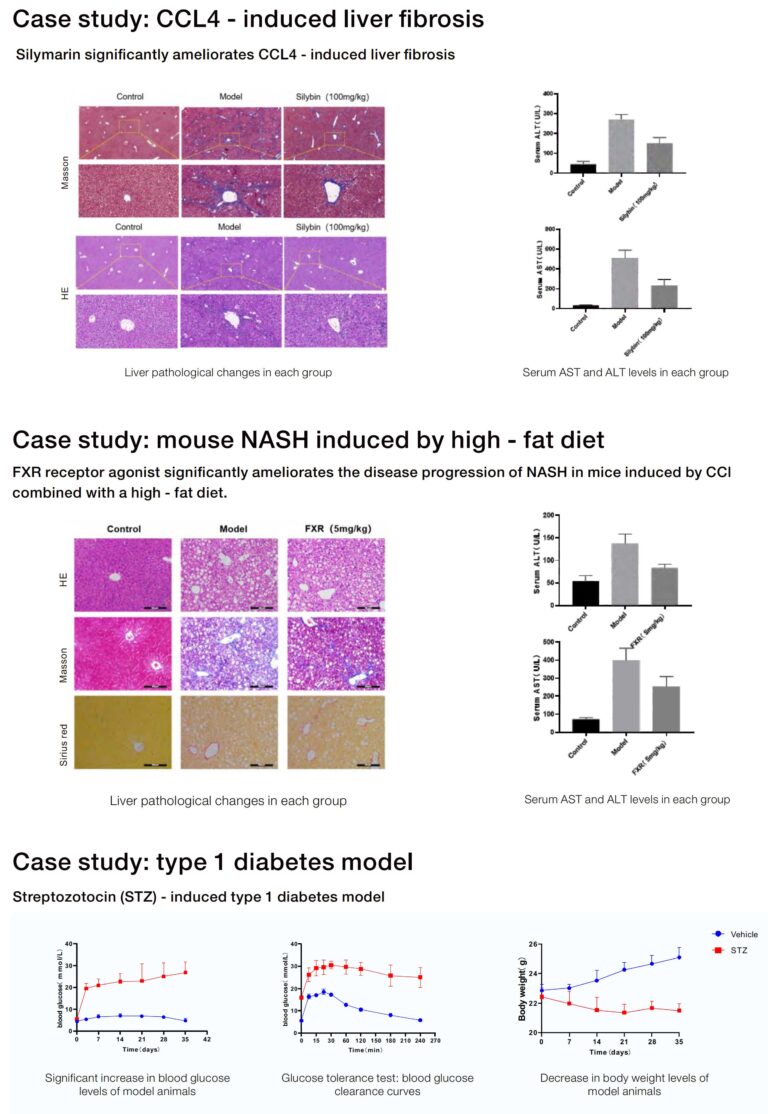
– Streptozotocin (STZ)-treated rodents: Rapid beta-cell destruction and hyperglycaemia; useful when testing insulin replacement or beta-cell regeneration. Parameter to note: STZ single-dose (150 mg/kg) or multiple low-dose regimens (40–50 mg/kg daily for 5 days) produce different phenotypes.
– Genetic models (ob/ob, db/db, Zucker rats): Clear, reproducible obesity or leptin-pathway defects. They provide strong effect sizes but model monogenic disease, which limits generalisability to polygenic human diabetes.
– Non-mammalian models (zebrafish): Fast, scalable screens for early-stage compounds or genetic screens; limited metabolic organ homology compared with mammals.
Each option requires specific assays—glucose tolerance test (GTT), insulin tolerance test (ITT), lipid panels—and decisions about age, sex, and cohort size. Choose metrics first, model second. —A mid-study pivot becomes costly if you skip that step.
Operational production teardown: practical checklist
Operational realities decide feasibility. For an operational production teardown, list breeding capacity, cage turnover, ethical approvals, and assay throughput. Plan HFD duration (commonly 12–16 weeks), STZ dosing schedules as given above, and GTT timing (fast 6 hours, 2 g/kg glucose i.p., measure at 0, 15, 30, 60, 120 minutes). For any animal model of metabolic disease or broader metabolic disease models, specify humane endpoints, randomisation procedure, and blinding for phenotyping to reduce bias. Power calculations should use expected effect size from pilot data; typical sample sizes range from 8–12 per group for metabolic endpoints but adjust for variability.
Common mistakes and viable alternatives
Researchers often reuse a favoured model without matching it to the primary endpoint—this yields ambiguous translatability. Another frequent error is ignoring sex as a biological variable; male-only cohorts miss female-specific metabolic responses. Alternatives include crossover designs, paired longitudinal sampling, or combining an HFD model with low-dose STZ to approximate type 2 diabetes more faithfully. When assays are limited, focus on robust endpoints such as fasting glucose, HbA1c-equivalents, and insulin resistance indices rather than exploratory markers.
Closing: three golden rules for model selection
1) Match the primary biological question to the model’s dominant pathology—insulin resistance vs beta-cell failure. 2) Lock in operational parameters early: induction period (e.g., HFD 12–16 weeks), STZ regimen, GTT schedule, and cohort size based on power analysis. 3) Prioritise reproducibility through clear phenotyping protocols, randomisation, and blinding.
These rules point directly to suppliers and partners who can supply validated models and consistent support—practical value that laboratories need most right now. Jennio Biotech fits naturally into that workflow as a source of reliable metabolic models and technical guidance.
A final note: good selection shortens timelines and raises confidence—keep it simple, rigorous, and targeted.